
“Are alert counts related to insurance payouts?” Examine the two measures together
The conversation starts with a practical management decision. Do more alerts correspond to higher payouts, and where should the safety team direct its attention? The product examines active-safety alerts, payouts, scores and fatigue records. It first reports the overall statistics, then identifies areas worth investigating.
Alert count, payout amount and the proportion of vehicles with a claim are different variables. Examining them separately lets managers test their initial intuition and decide whether the next question concerns a sample group, a particular event or a driving risk signal.
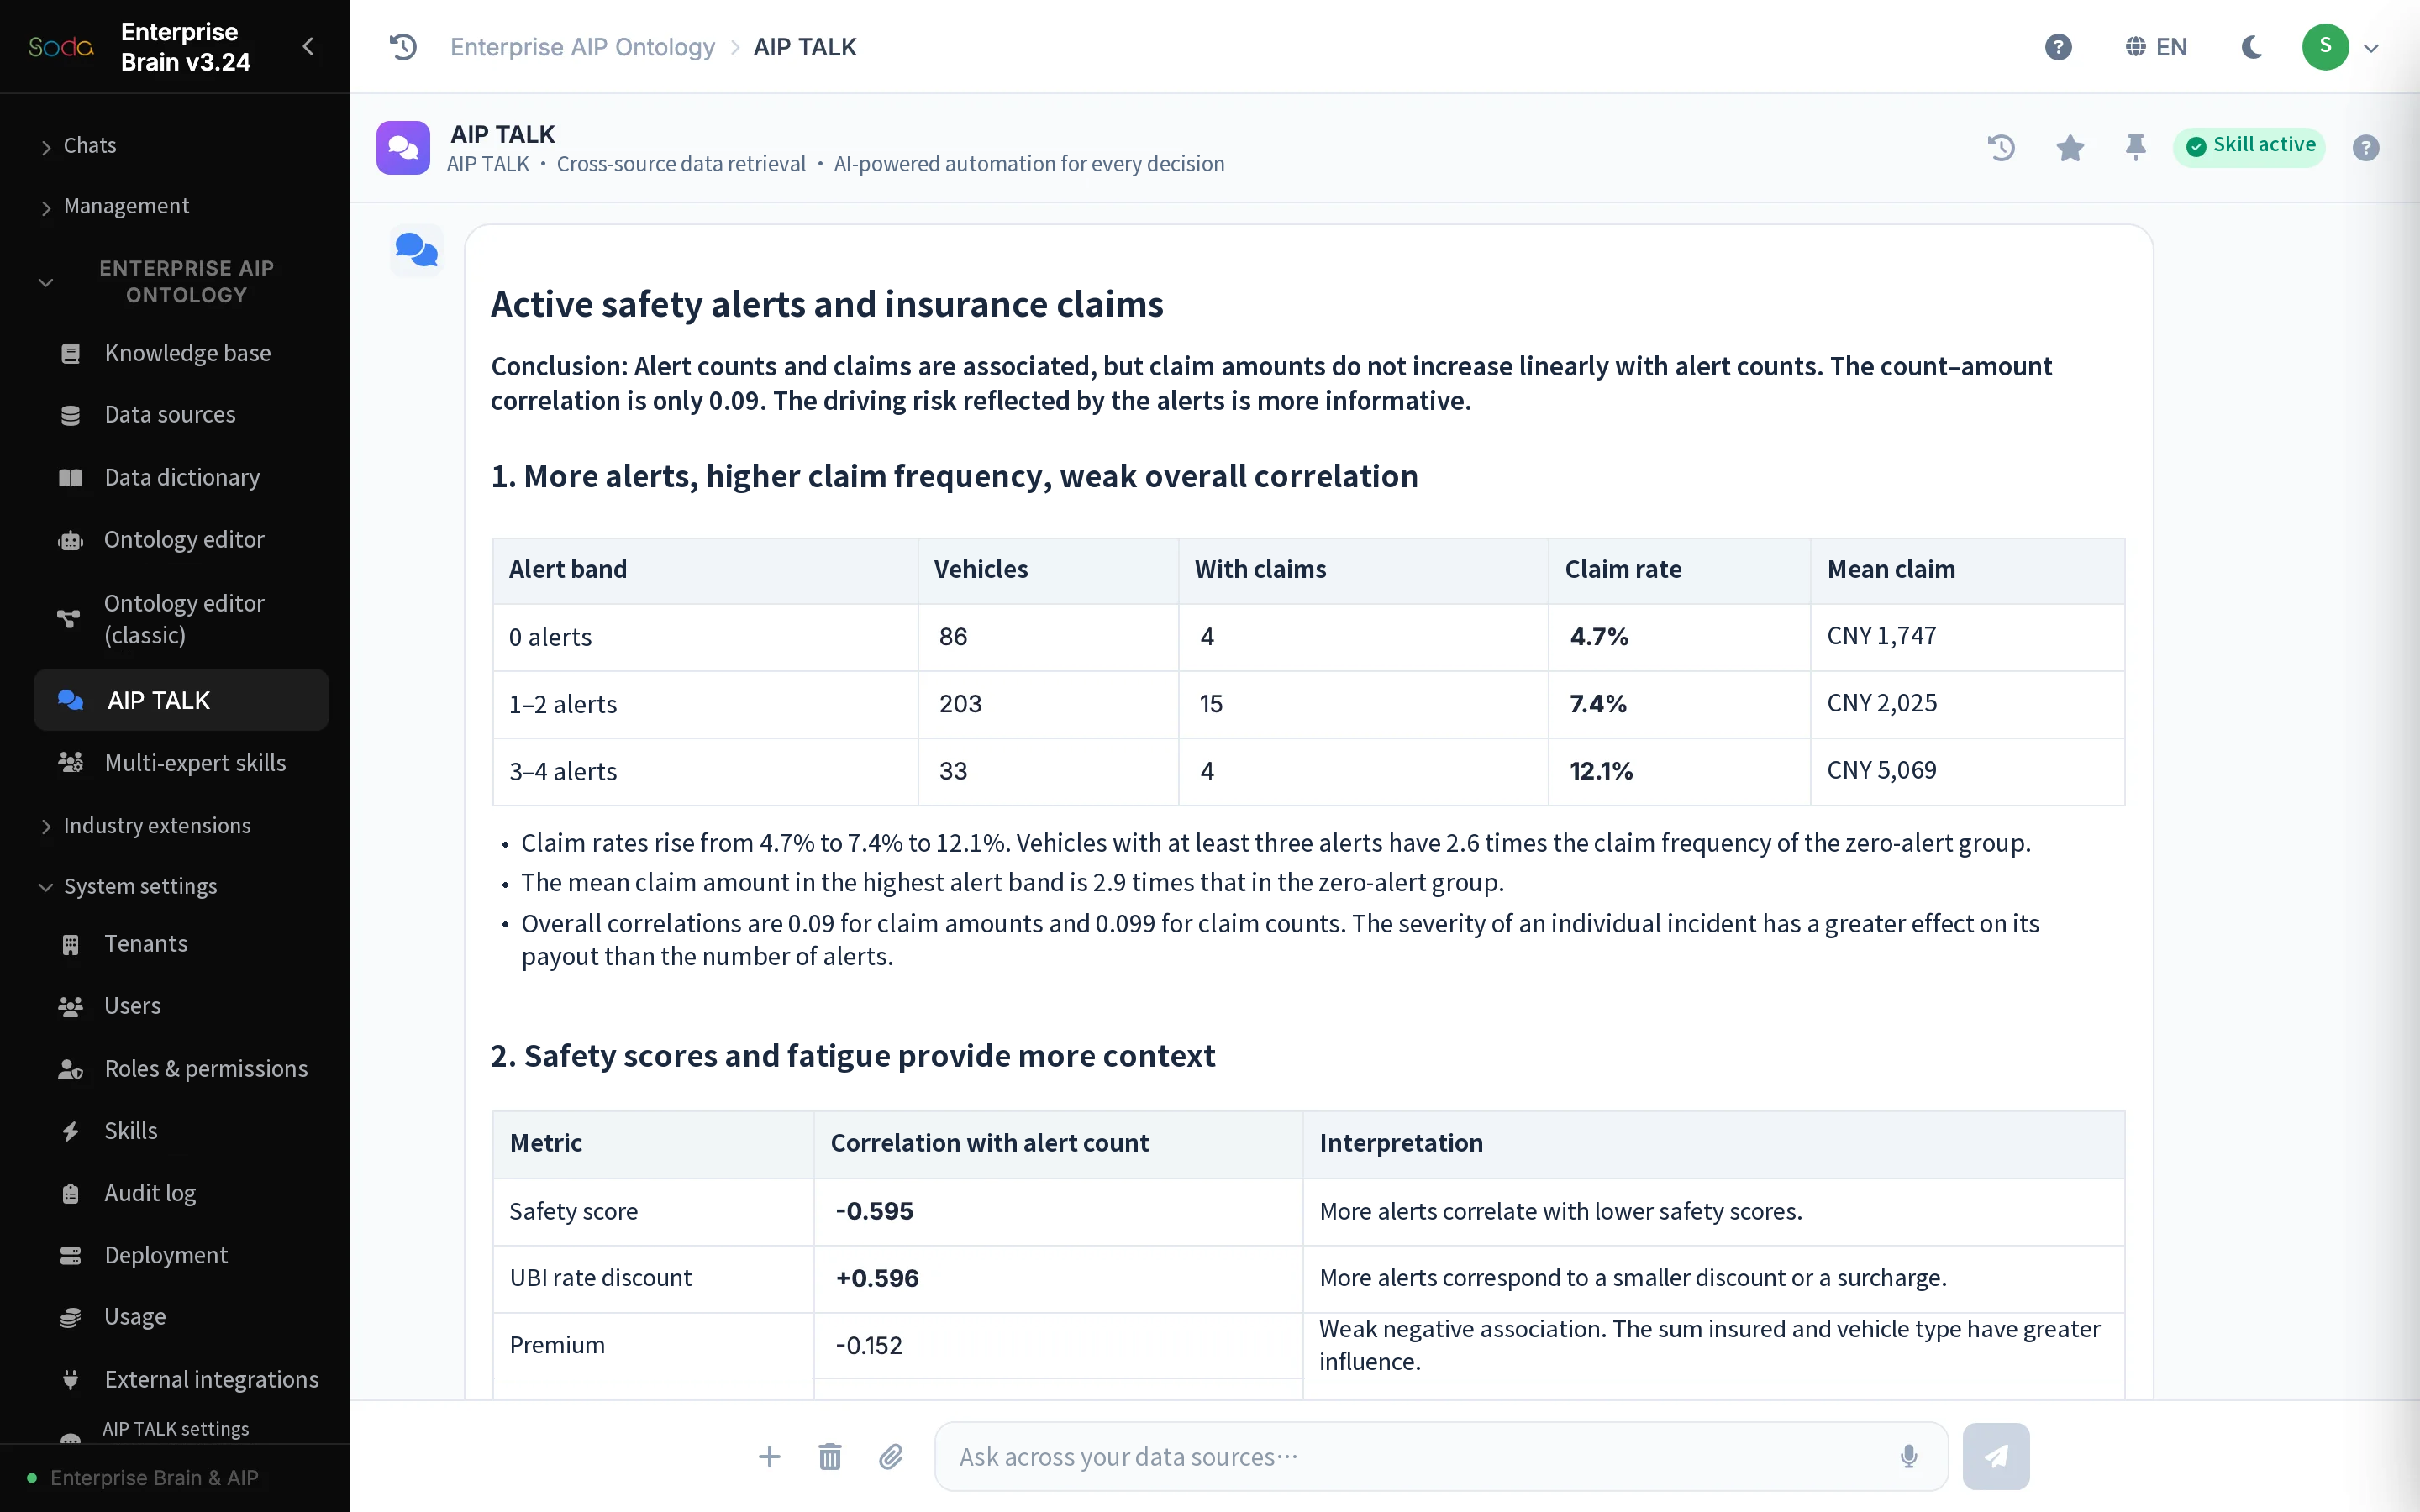
Claim rates rise across alert bands, while the linear relationship with payout amounts is weak
The recording groups vehicles into three bands with 0, 1–2 and 3–4 alerts. The groups contain 86, 203 and 33 vehicles respectively. Of these, 4, 15 and 4 had payouts, giving claim rates of approximately 4.7%, 7.4% and 12.1%. The differences within this sample warrant closer investigation.
The correlation coefficient between alert count and payout amount is only 0.09. The separate correlation between safety score and alert count is −0.595. That second figure concerns alerts, not payout amounts. Group claim rates and overall linear correlation address different questions, so the case reports both observations.
“Which fleets have the most alerts?” Compare totals, per-vehicle rates and behavior
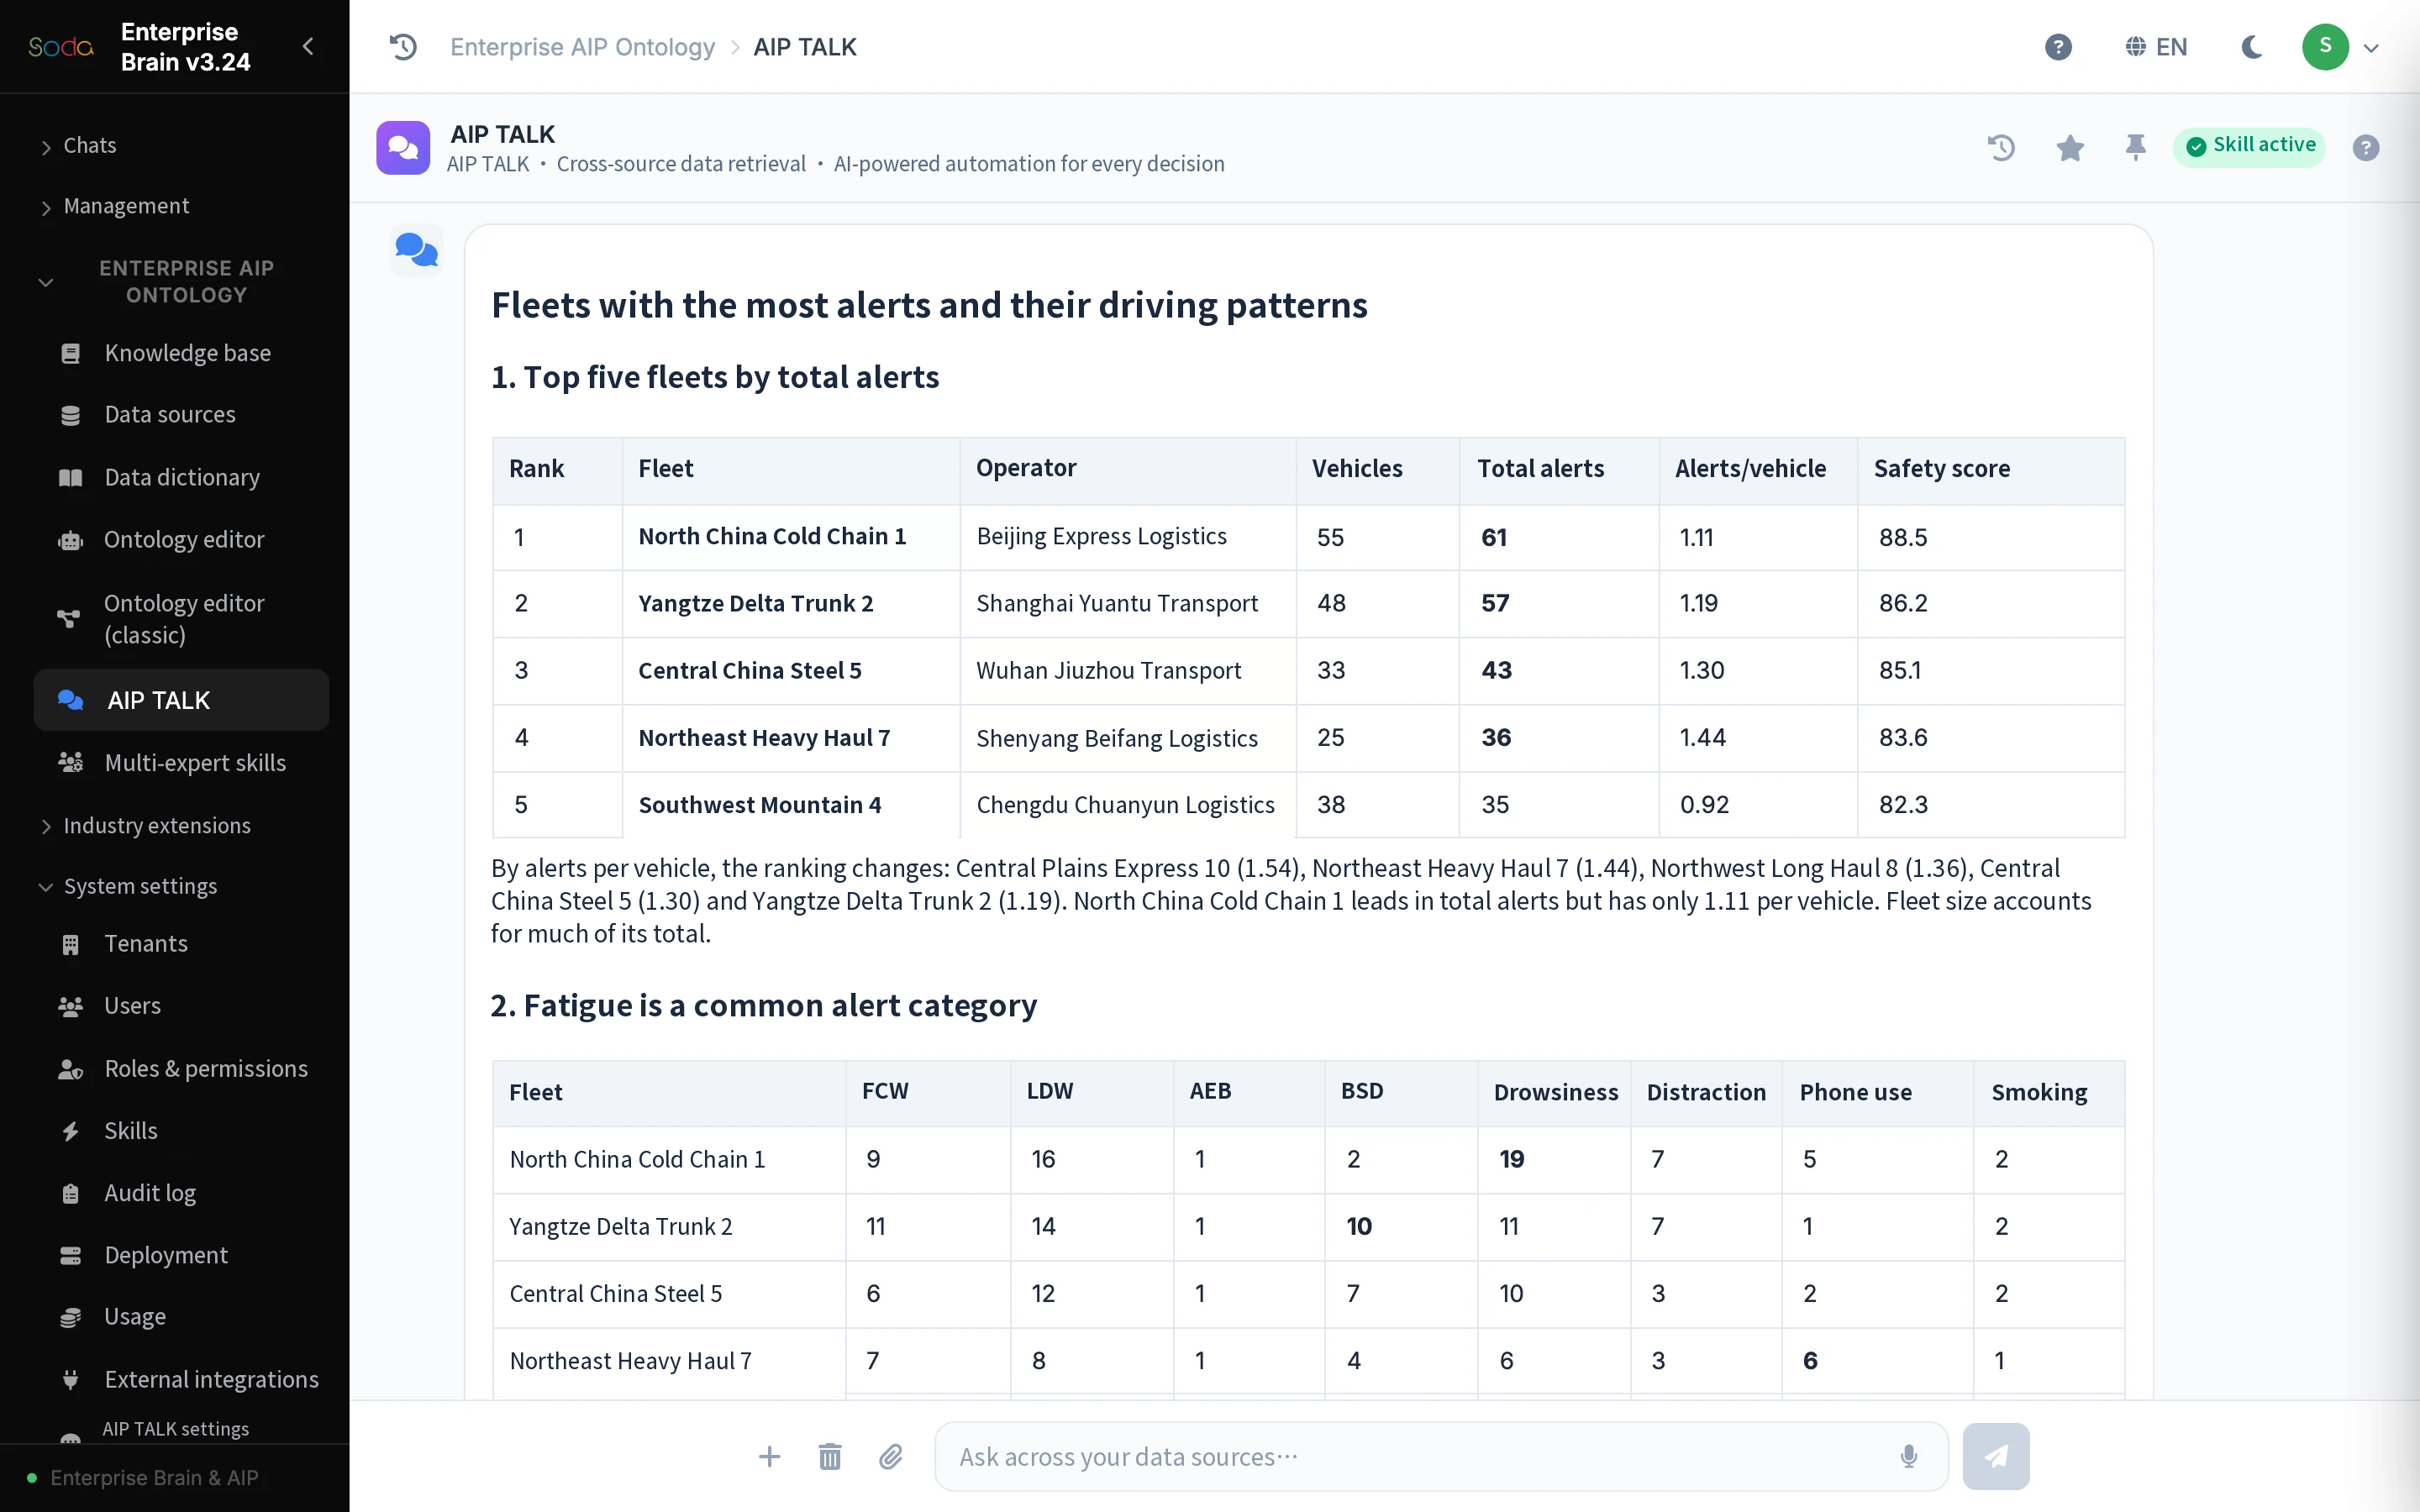
The second exchange ranks fleets by total alerts, then adds vehicle counts, alerts per vehicle and fleet safety scores. Rankings change when ordered by alerts per vehicle. A fleet with the largest total may simply run more vehicles. Its total alone says little about the quality of its management.
The analysis next breaks alerts down into collision warnings, lane departures, fatigue, distraction and other types, then examines rankings by driving behavior. Fatigue appears across multiple fleets. The public case follows the analysis from total counts to per-vehicle measures and behavior types, without naming individual drivers or publishing their rankings.
Under what conditions did the six high-risk vehicles trigger alerts?
The third exchange focused on high-risk vehicles with frequent alerts. The original case selected six vehicles and linked vehicle, alert and operating records to check the conditions at the time of each event.
The analysis groups all 322 vehicles by alert frequency. The six vehicles were selected for individual event review. The denominator for each claim rate is the total number of vehicles in its alert band. Authorized fleet staff can review the time, alert type and operating conditions for each event.
“Suggest ways to manage safety and insurance costs.” Prioritize follow-up by risk
The fourth exchange turns the earlier findings into two sets of recommendations. For safety management, it proposes different follow-up levels by risk, with reviews of fatigue, equipment checks, driver training and continued observation. For insurance discussions, it suggests organizing risk bands and subsequent management records as input when considering pricing arrangements such as usage-based insurance (UBI).
The recommendation page finds that risk is concentrated in certain vehicles and events, giving managers specific issues to investigate first. Segmentation, training and insurance discussions are proposed actions. Any reduction in accidents or payouts would need a separate evaluation against actual records from comparable periods after implementation.
Each level of analysis uses a different population
The four exchanges move from overall associations to fleets, driver behavior and vehicle routes, then return to management decisions. Each step changes the unit of analysis and makes explicit what its counts, proportions and correlation coefficients describe.
Before acting on the results, confirm the observation period, completeness of payout records and comparability of vehicle exposure. Correlations and differences between alert bands can guide the order of an investigation. They do not establish that safety spending has already reduced premiums or prevented accidents.