
How many cases occurred at sea, on inland waterways and in harbors?
The first exchange compared the operating settings of the salvage cases. Of the 108 cases in the published review, 80 occurred at sea (74.1%) and 28 on inland waterways or in harbors.
These counts establish a baseline for examining distance, incident type and resources deployed. The source panel separately reports 107 result rows. Checking the records requires reconciling the aggregation rules for the 108 cases with the coverage of those 107 rows.
“Compare cost factors in a forest plot.” Read estimates alongside uncertainty
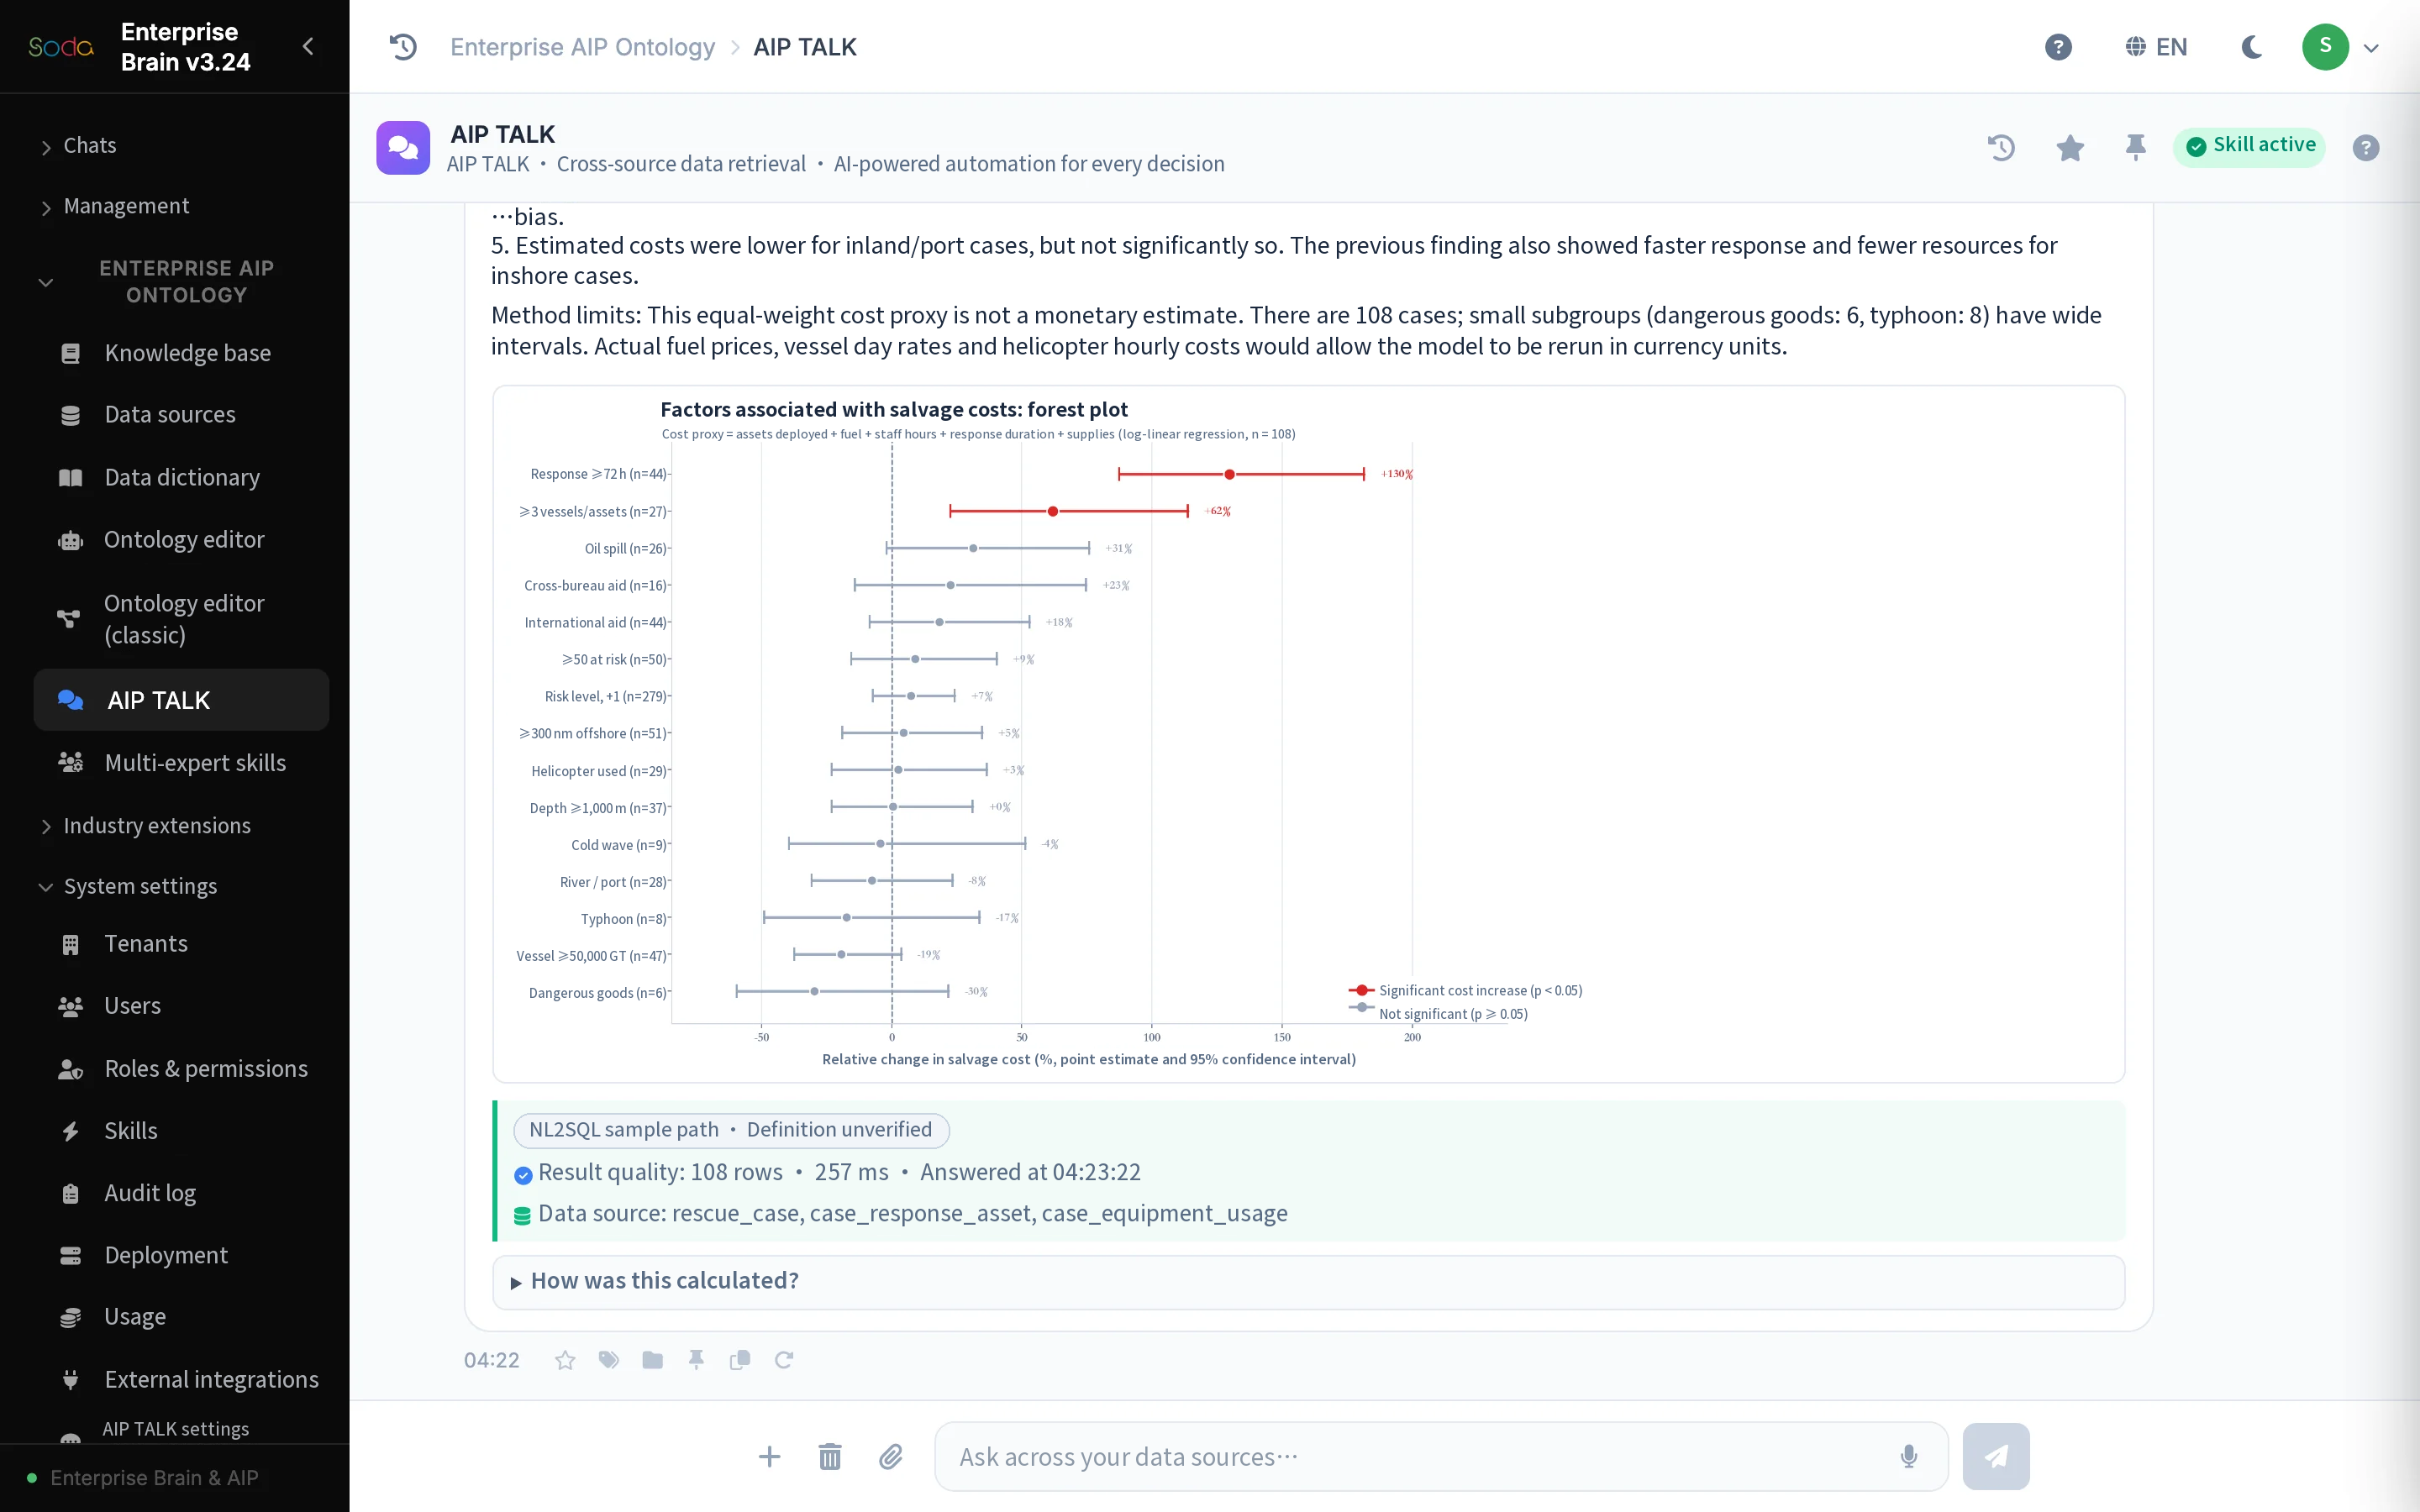
The second question requests a forest plot of factors associated with salvage cost. The recording shows point estimates and 95% confidence intervals. The groups reaching 72 hours of response time and 3 vessels deployed correspond to estimated relative changes of approximately +130% and +62%, respectively, in this analysis. The plot also retains the uncertainty around other factors.
The plot uses an equally weighted cost proxy. It has not been priced using fuel rates, vessel hire or helicopter hourly costs. It identifies factors associated with resource use for further study. The percentages are not changes in actual costs in CNY. Some groups have small samples and wide intervals, which limits the stability of the estimates.
“Which cases count as major accidents?” Compare manual labels with the screening rule
The third request asks to screen cases against major maritime accident criteria. The product compares manually assigned severity labels in the database with the cited statistical rules. The two do not fully agree, indicating that a screen using existing labels alone could miss entries requiring review.
The recording contains results of both 24 and 25 cases. The narrative filters on fatalities, while the table uses fatalities and missing persons combined. Preserving the distinction lets reviewers revisit the fields, applicable rules and original records. These are query results for review, not formal accident classifications.
“How were resources allocated?” Compare distance offshore and incident size
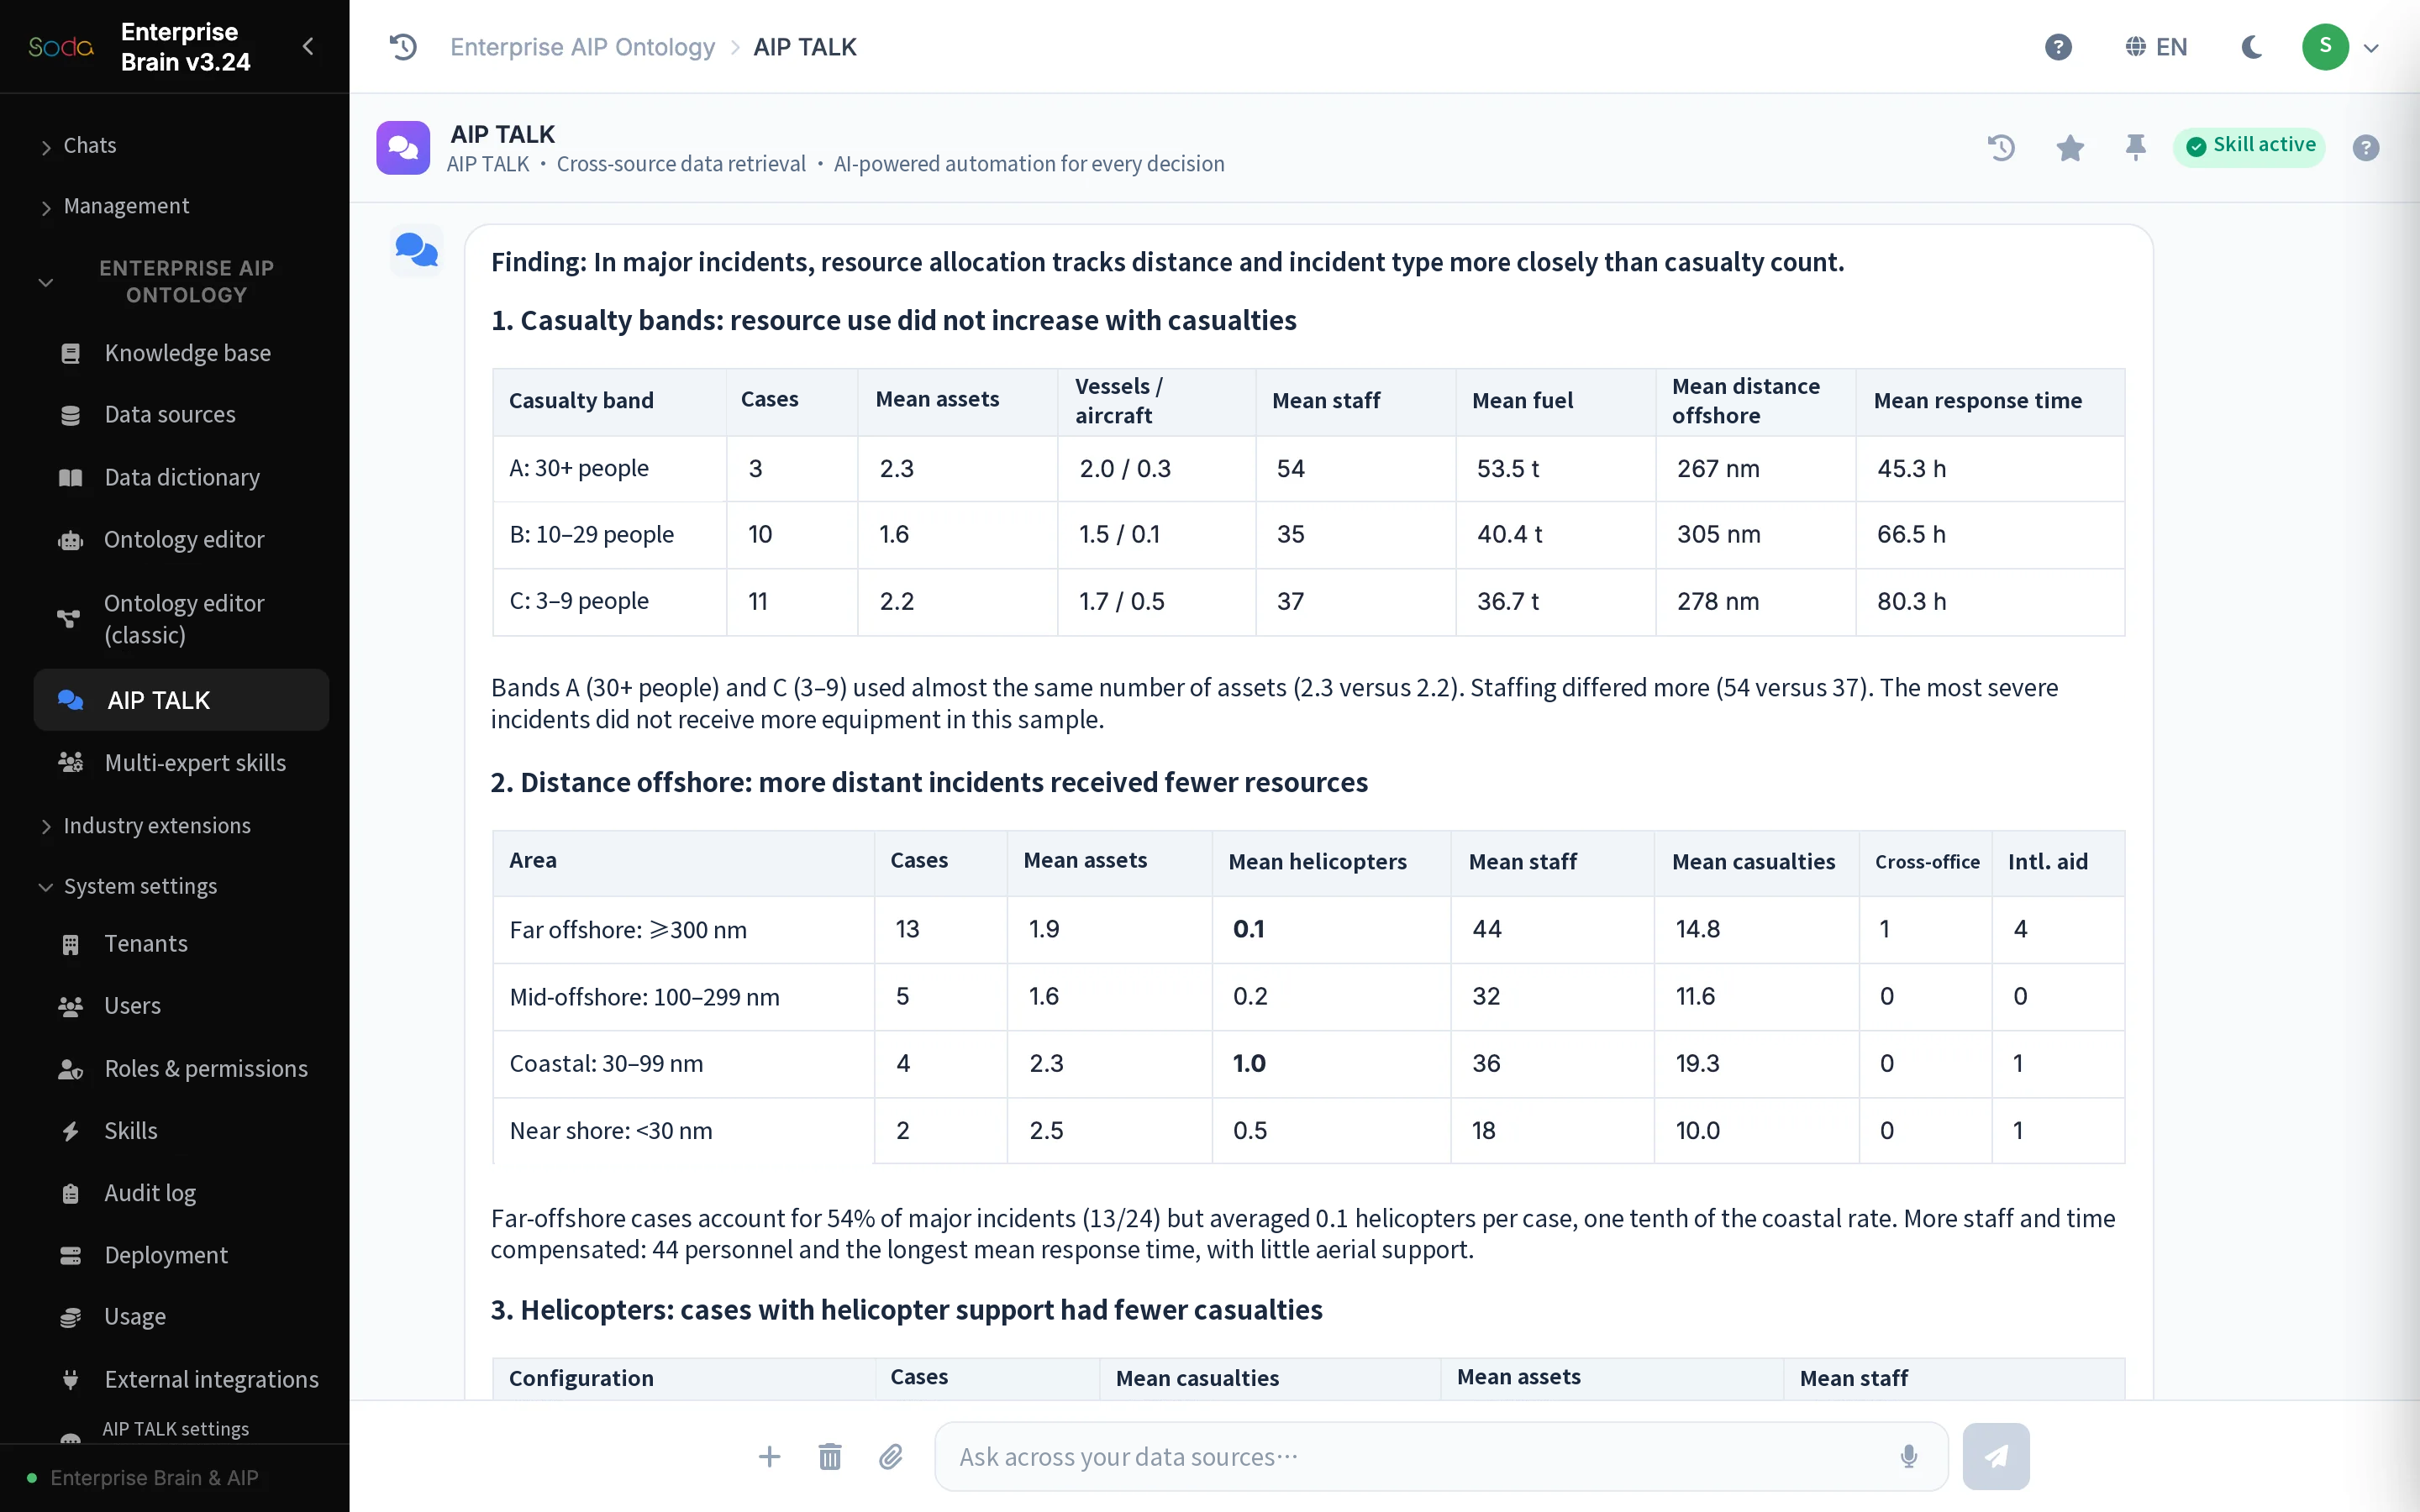
The fourth question groups the selected incidents by casualties and distance offshore, comparing equipment, vessels and aircraft, personnel, fuel and response duration. The resource table uses a subsample of 24 cases. Thirteen occurred at least 300 nautical miles offshore, about 54% of the sample. Average helicopter deployment was 0.1 aircraft per case in the distant offshore group and 1.0 per case in the nearshore group.
The recording also observes that equipment commitments did not increase in step with casualty counts across groups. That raises questions about resource accessibility, distance and incident type. Group averages alone cannot establish what equipment an individual incident required or whether an allocation caused the casualties observed.
Use the findings to frame resource planning questions
Drawing on the share of distant offshore cases, aircraft use and response durations, the original answer proposed studying the forward positioning of offshore aviation resources. Reviewers can compare distance and equipment use across groups, then check actual costs and available capacity.
Further planning requires a professional assessment of equipment availability, range, weather and sea conditions, coordination and current mission information. The case provides investigative and planning leads from a historical sample. Operational dispatch remains with the responsible command process.
Which cases contributed to each comparison?
The source panel in the product identifies the tables queried and their result records. Readers can follow the evidence to see which findings cover the full population and which apply to a filtered subset.
The waterway comparison covers 108 cases. Two definitions of a major incident identified 24 and 25 cases respectively, and the resource review used 24. Comparing estimated effects across groups also requires the original definition of the cost proxy.